Why Use the River?
Water transportation provides tremendous carrying capacity while consuming far less energy compared to other modes of transport such as truck, rail or air. Shippers select barge transportation because these energy efficiencies lead to substantial cost savings. One gallon of fuel can move one ton of cargo 514 miles by barge compared to 202 miles by train and only 59 miles by truck.
Roadway congestion is decreased as freight is transferred to waterways where significant capacity is available without additional infrastructure expenditures. Water transportation stimulates the regional economy through attraction of new industries, jobs and growth in the tax base.
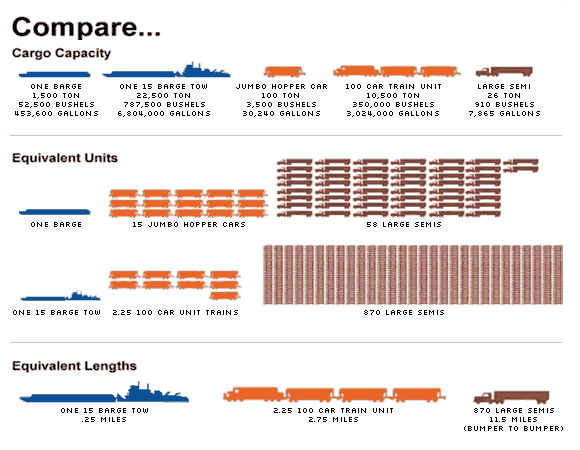
Unit Capacities
A fully loaded covered-hopper barge can carry enough wheat to make almost 2.5 million loaves of bread. That is nearly enough product to provide a loaf of bread to nearly every Kansas resident. A loaded tank barge carrying oil can satisfy the current annual gasoline demand of approximately 2500 people for one full year.
| Modal Freight Unit | Standard Cargo Capacity |
|---|---|
| Highway - Truck Trailer | 25 Tons |
| Rail - Bulk Car | 110 Tons |
| Barge - Dry Bulk | 1,750 Tons |
| Barge - Liquid Bulk | 27,500 BBL |
Energy Efficiency
The marine fuel efficiency rates are based on TVA energy consumption data; the railroad efficiency rates are based on an analysis of railroad industry, Surface Transportation Board (STB), and Security and Exchange Commission (SEC) data; and truck efficiency rates are based on EPA MOBILE6 data.
| Mode of Transport | Ton-Miles / Gallon |
|---|---|
| Truck Freight | 155 |
| Railroads | 413 |
| Inland Towing | 576 |
Safety Impact
Both rail and truck statistics include incidents involving only vehicular crashes or derailments. However, the waterborne database reports incidents resulting from a wide variety of causes.
| Mode of Transport | Fatalities |
|---|---|
| Truck Freight | 155 |
| Railroads | 22.7 |
| Inland Towing | 1 |
| Mode of Transport | Injuries |
|---|---|
| Truck Freight | 2171.5 |
| Railroads | 125.2 |
| Inland Towing | 1 |